Electronics Explorer Board - Using the Power Supplies
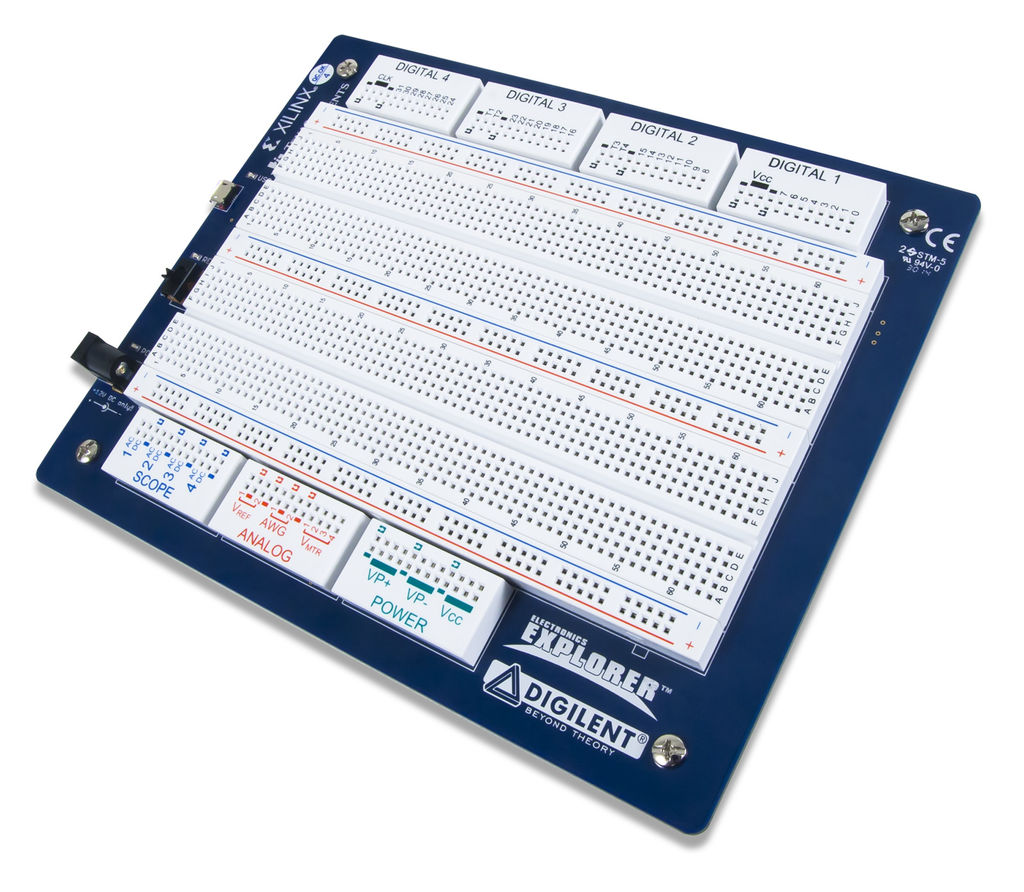
The Electronics Explorer Board power supplies have many more capabilities and options than the Analog Discovery 2.
Inventory
- 1 Electronics Explorer Board
- A computer with USB port to run the software
If you want some help getting your Electronics Explorer Board set up and calibrated, or installing WaveForms, check out this quick start Instructables collection. The calibration is similar to the Analog Discovery 2, and I recommend you calibrate your Electronics Explorer board before using it. You will need to have a high-wattage (≅10W) resistor between 10-50Ω and a quality voltmeter to finish the calibration.
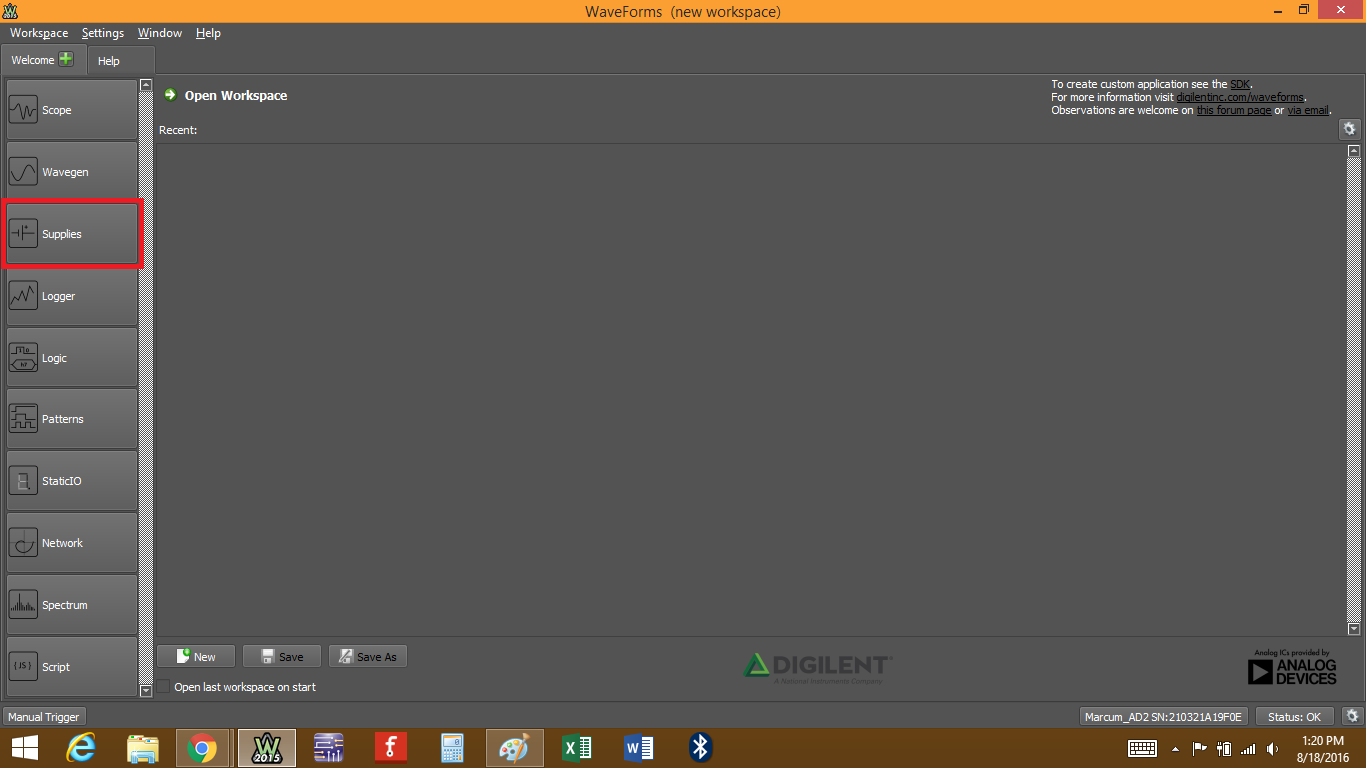
Once you have your Electronics Explorer Board and WaveForms all set up, open the power supplies by clicking on the “Supplies” button.
This will open the power supplies window.
At the top you have three options: “File”, “Control”, and “Window”.
- “File” lets you Save the current power supply settings as a new project, You can then Open that project to set the power supplies to the saved setting. You can Export the power supply settings, either as an image or as raw data in *.csv, *.txt, or *.tdms format. You can also Close the power supplies window from here.
- “Control” gives access to the Run and Stop functions.
- “Window” lets you view other Waveforms tools you have open, the main Waveforms screen, or the Help window.
Below that you have the controls for each of the four power supply types.
At the top left is Master Enable, which will turn on/off any power supply channel that has a check mark in the list below that button. Any channel that is not checked will not turn on with the Master Enable button.
There are four boxes to the right of the enable boxes.
At the top left is the Positive Supply (VP+). You can set the voltage to any value between 0 and +9V out to 3 decimal places. You can also set the max current limit to any value between 0 and 1.5A out to 3 decimal places. Once VP+ is enabled and turned on, the Electronics Explorer Board will send back real time voltage and current data, which will be displayed in the box below the drop-down menu.
Below the Positive Supply is the Negative Supply (VP-). The parameter limitations are the same as fro VP+, except negative instead of positive. Real time data will also be displayed once VP- has been enabled and turned on.
To the top right you have your Fixed Supply (Vcc). You can choose either +3.3V or +5V. This is really useful for powering microcontrollers, microprocessors, or FPGA chips that require a steady power supply. Real time voltage and current data is displayed below the drop-down menu. You cannot limit the current available on this channel.
Below the Fixed Supply are the Reference Volatges (Vref1 and Vref2). You can set these values anywhere between -10V and +10V. Decimal precision varies with whether you are using mV or V values. There is no real time data from the Electronics Explorer Board monitoring these pins.
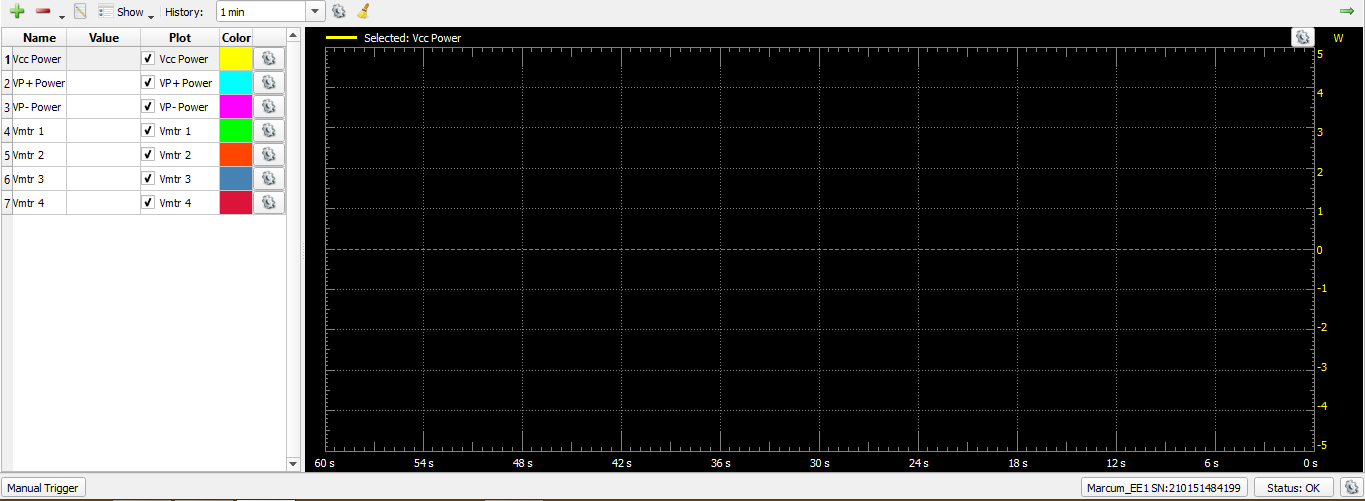
Next is the plot window.
At the left side you have various metrics that you can use to monitor your circuit. The Value column shows the value as of the last sample.
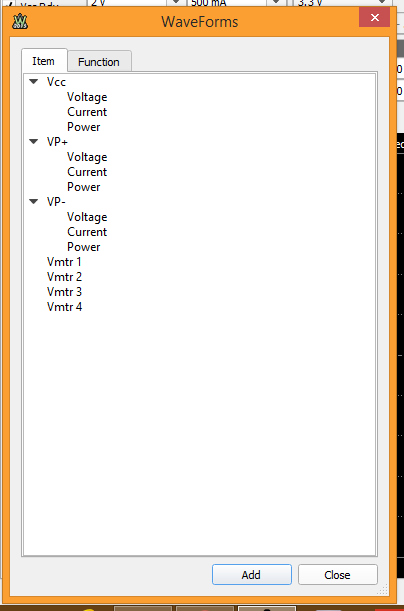
By clicking on the button displayed below, you can select from a list of additional metrics to add to the watch list.

Double click on the metric you want to add, then click “Close”. The new metric will appear at the bottom of the list. Note that Vmtr n is an exclusive function to the Electronics Explorer Board and designates one of four built-in voltmeters on the board itself. They measure voltage in reference to the internal GND plane of the Electronics Explorer Board.
Clicking on the button below lets you remove the selected metric or clear all metrics at once. You can also press “Delete” on your keyboard to remove a highlighted metric.

With a metric highlighted, the button displayed below lets you reassign a metric to that slot. You can have as many instances of the same metric as you want. You can also just double click on a metric to reassign that slot to a different metric.

The button below will add Maximum and Minimum columns to each metric, next to the Value column. As more samples are taken, these values will change to reflect the max or min value that has been measured by that metric.

The History box sets the total metric history that is viewable in the plot window. You can set this value to most values between 10s and 24 hours. If the value you enter won't work, the plot will auto-correct to the closet value that will work.

The button below lets you change the plot update rate and how many samples are shown in the plot window. Be aware that these two values are tied to the value in the History box, and changes in one will likely affect one or both of the other two.

The button displayed below will clear the plot window of all metric traces. This can be done at any time, whether the supplies are on or off. New traces will become visible as more samples begin to register.

The Plot column has a box for each metric to enable/disable that particular trace on the plot. Check the box to enable the trace.
To change the color of the trace clock on the color box in the Color column. Pick your new color from the window that opens and click “OK” to change it.
Each metric has a small gear icon, as displayed below, in the last column right next to the plot window. This lets you set the vertical plot scale for that particular metric. Auto adjustment is set by default, but you can set the unit/division value and the offset value.

In the top right corner of the plot another small gear icon is displayed. You can add or remove labels to the plot, change the background from black to white, and change the default trace width for all metrics. If you click on a metric, its trace will be slightly wider than the others and will also rise to the top layer of the plot to make it easier to see.

Lastly, just above the top right corner of the plot, you'll see a green arrow. This will make the plot slide closed, widening the metric value columns on the left to allow for clearer viewing of the data. Click it again to slide the plot window back open. The plot will continue to update even if it is closed, and opening it will show the accurate history according to the rate, sample, and history settings.


