OpenLogger - Data Logger
Simple Logging - Charting Data in WaveForms Live
1.
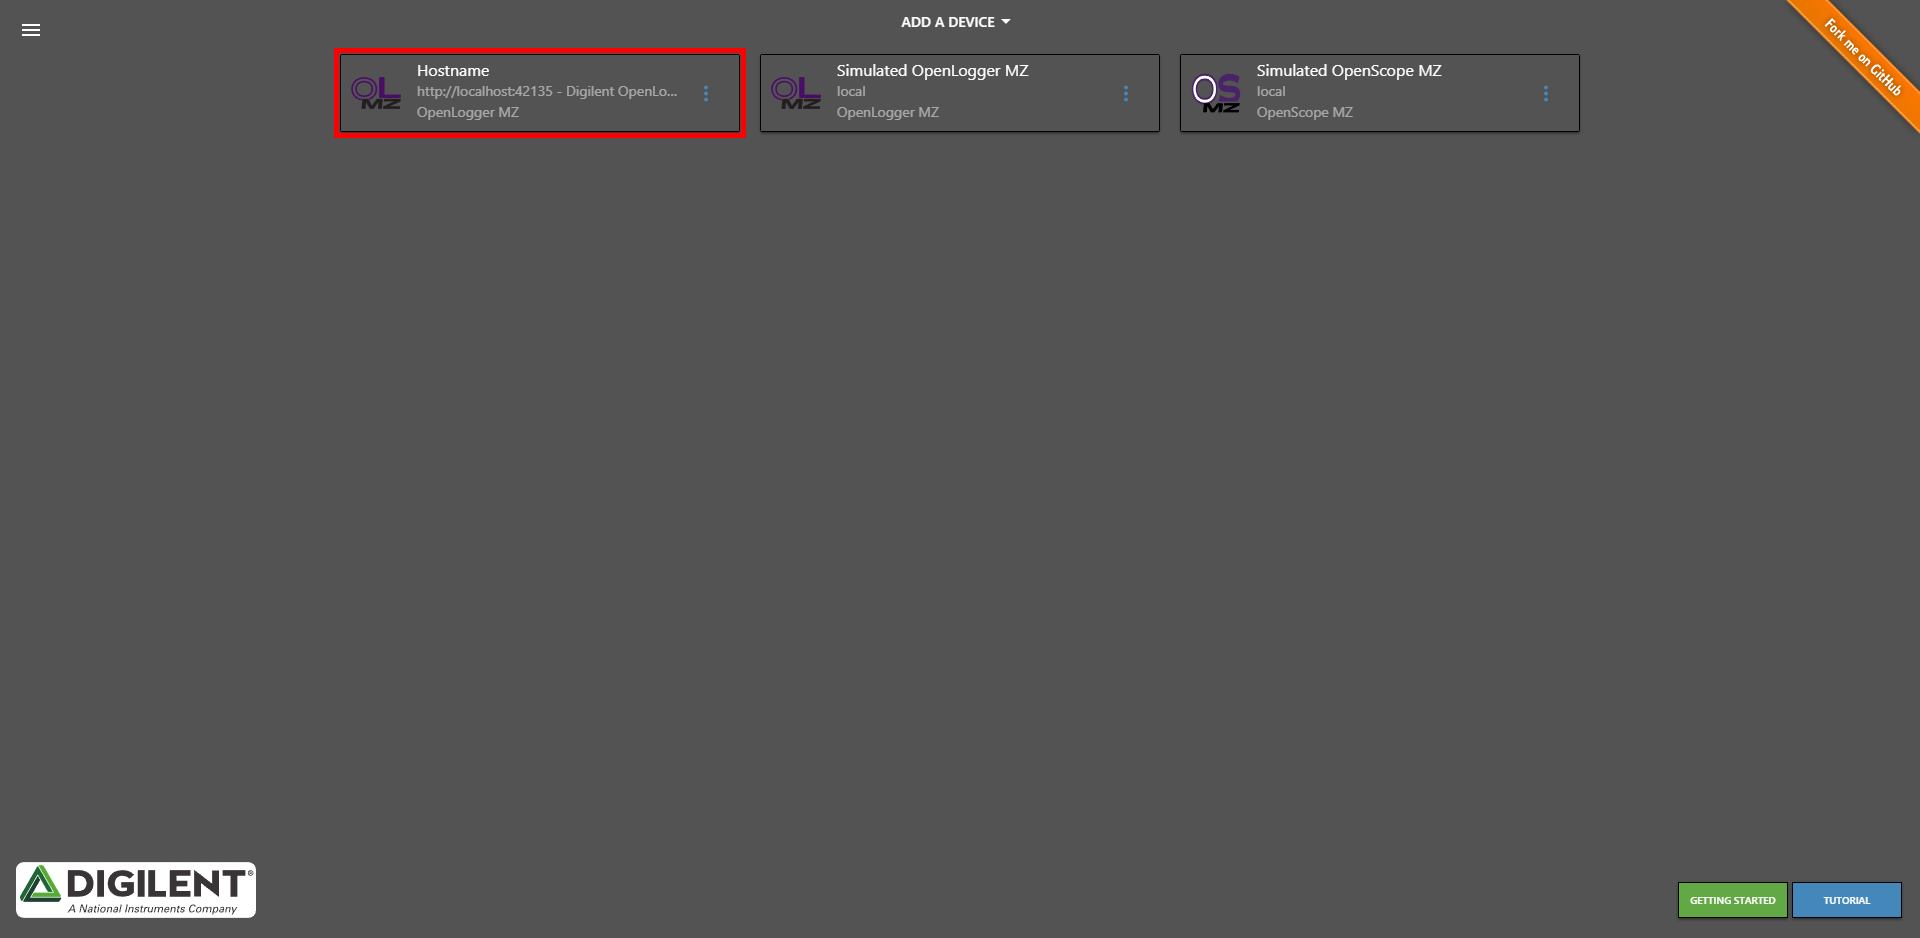
The OpenLogger's Data Logging functionality can be accessed through the main screen of WaveForms Live. First click on the device in the Device Manager to begin interacting with it.
2.
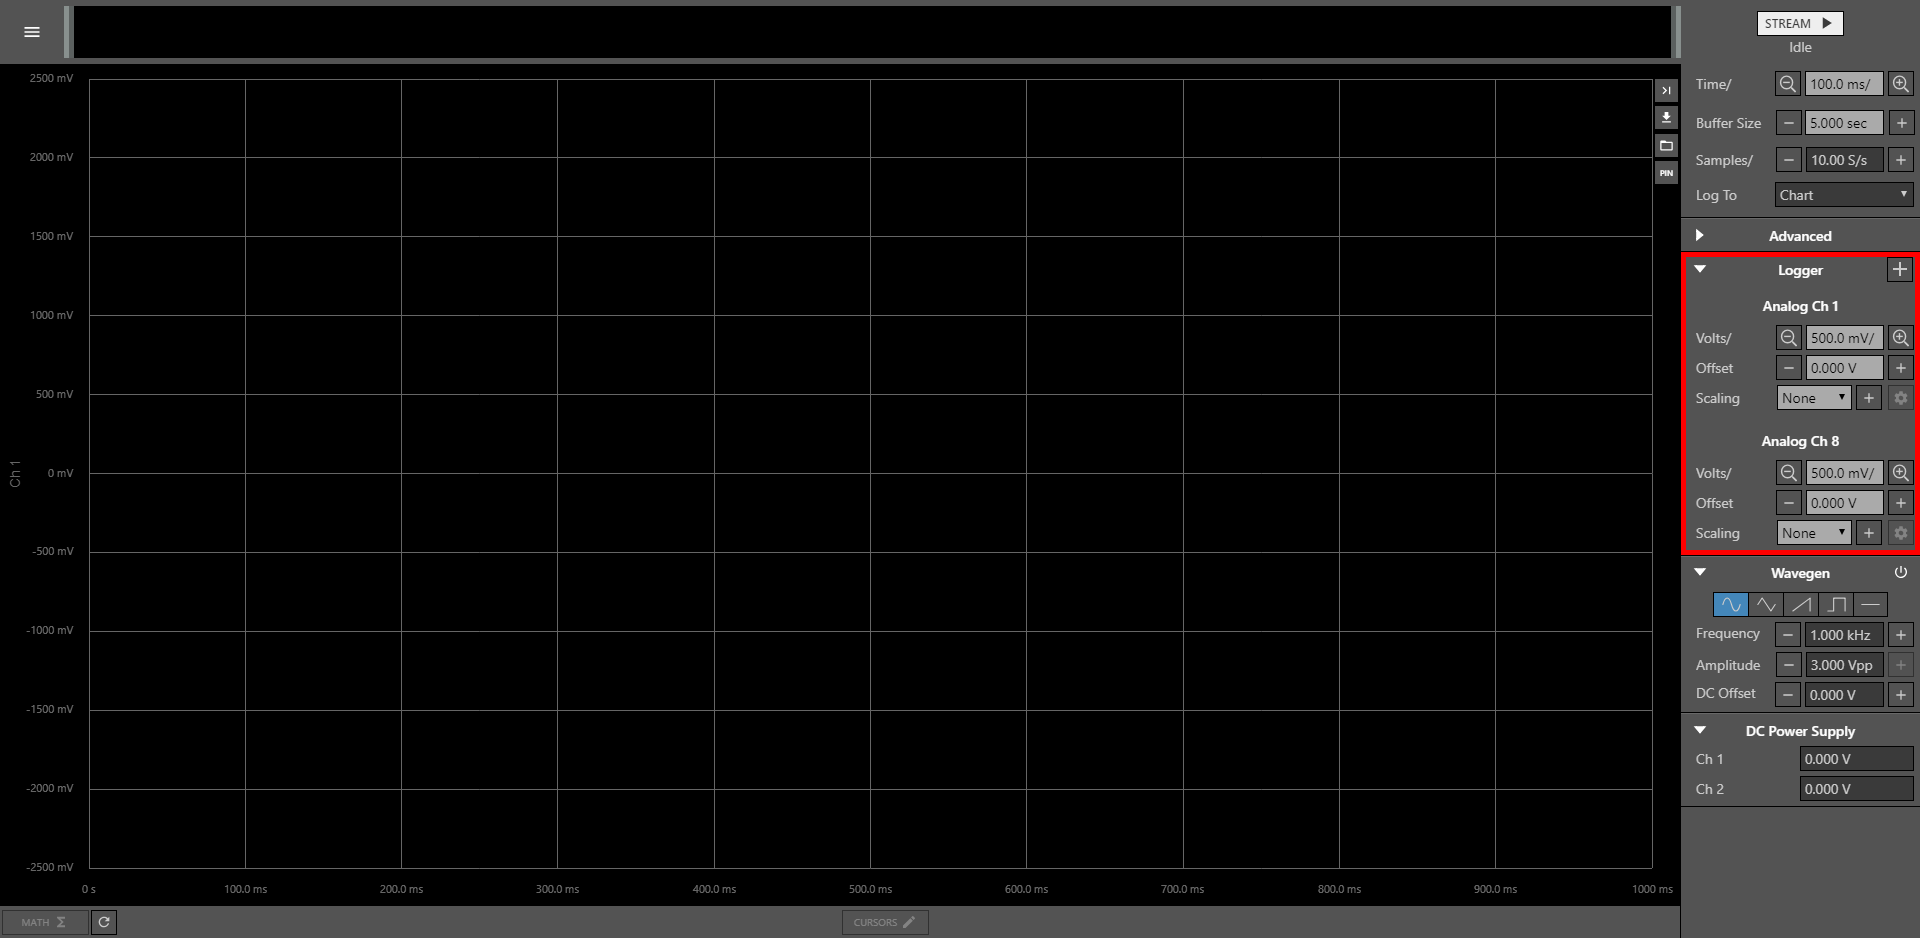
In the Instrument Panel to the right of the screen, the Logger section can be seen. This instrument configures how logged data is displayed on the chart, and how the OpenLogger captures data.
3.
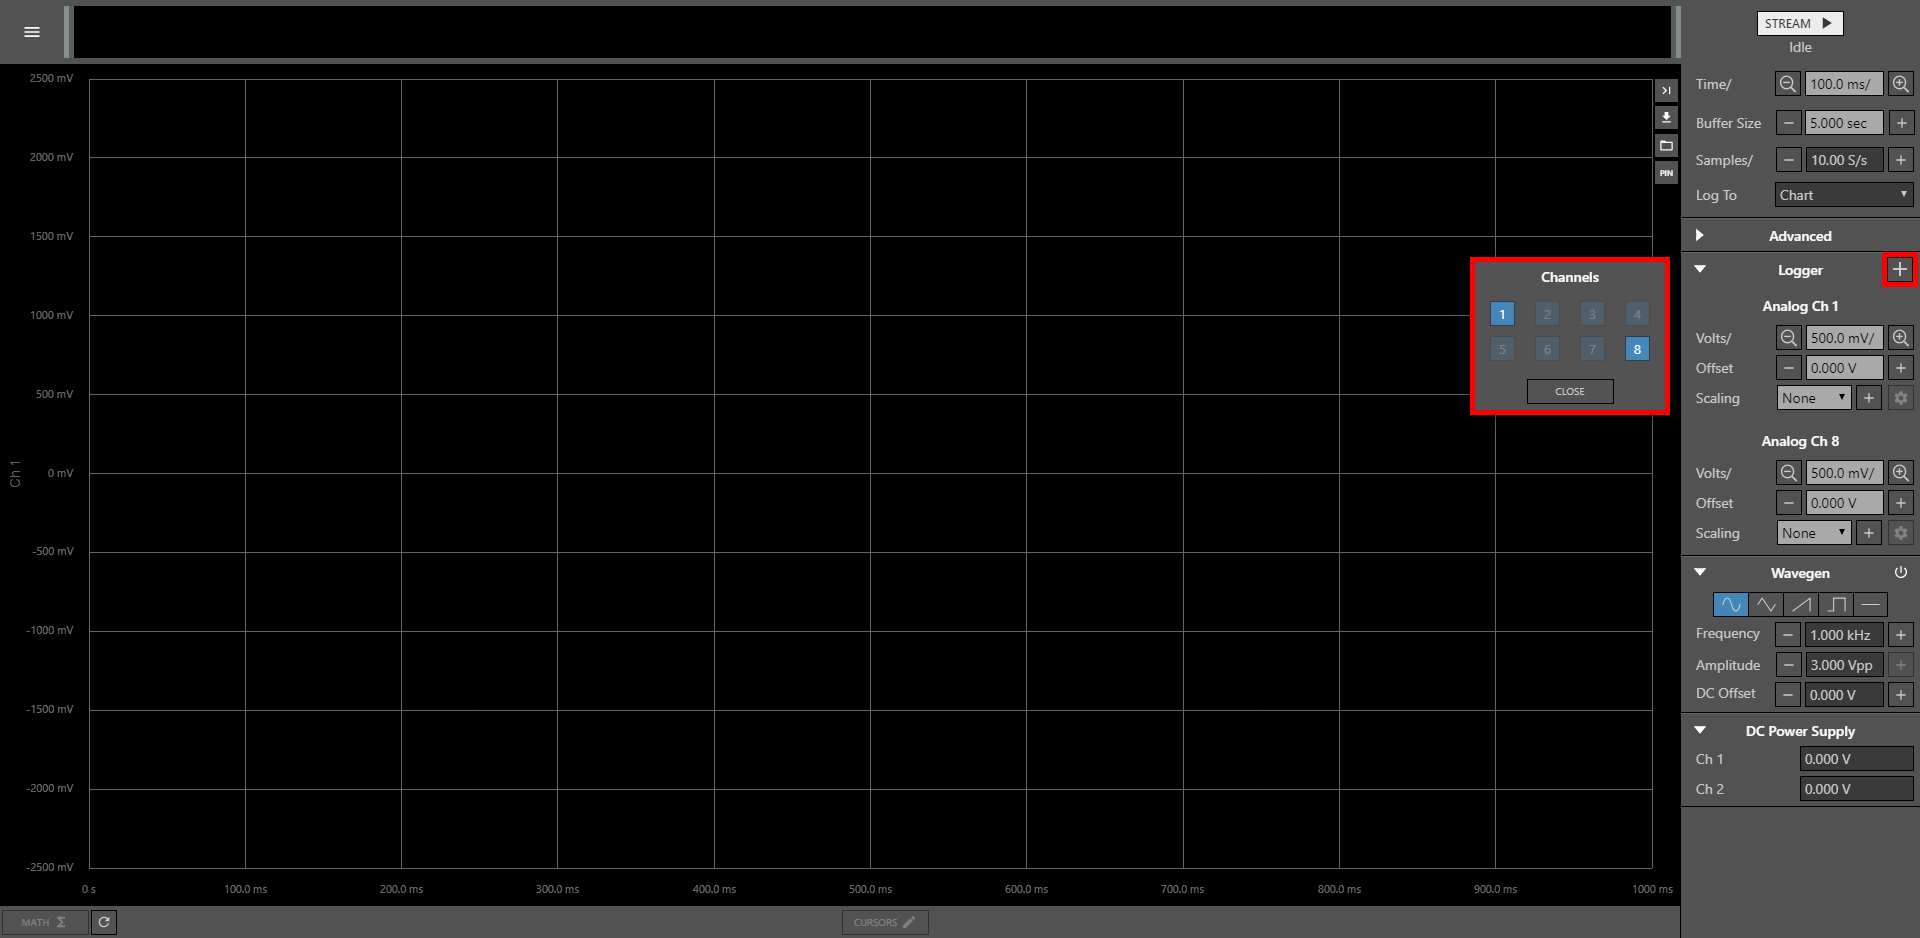
Clicking the “Plus” button in the Logger instrument allows the user to select which analog input channels will be used.
4.
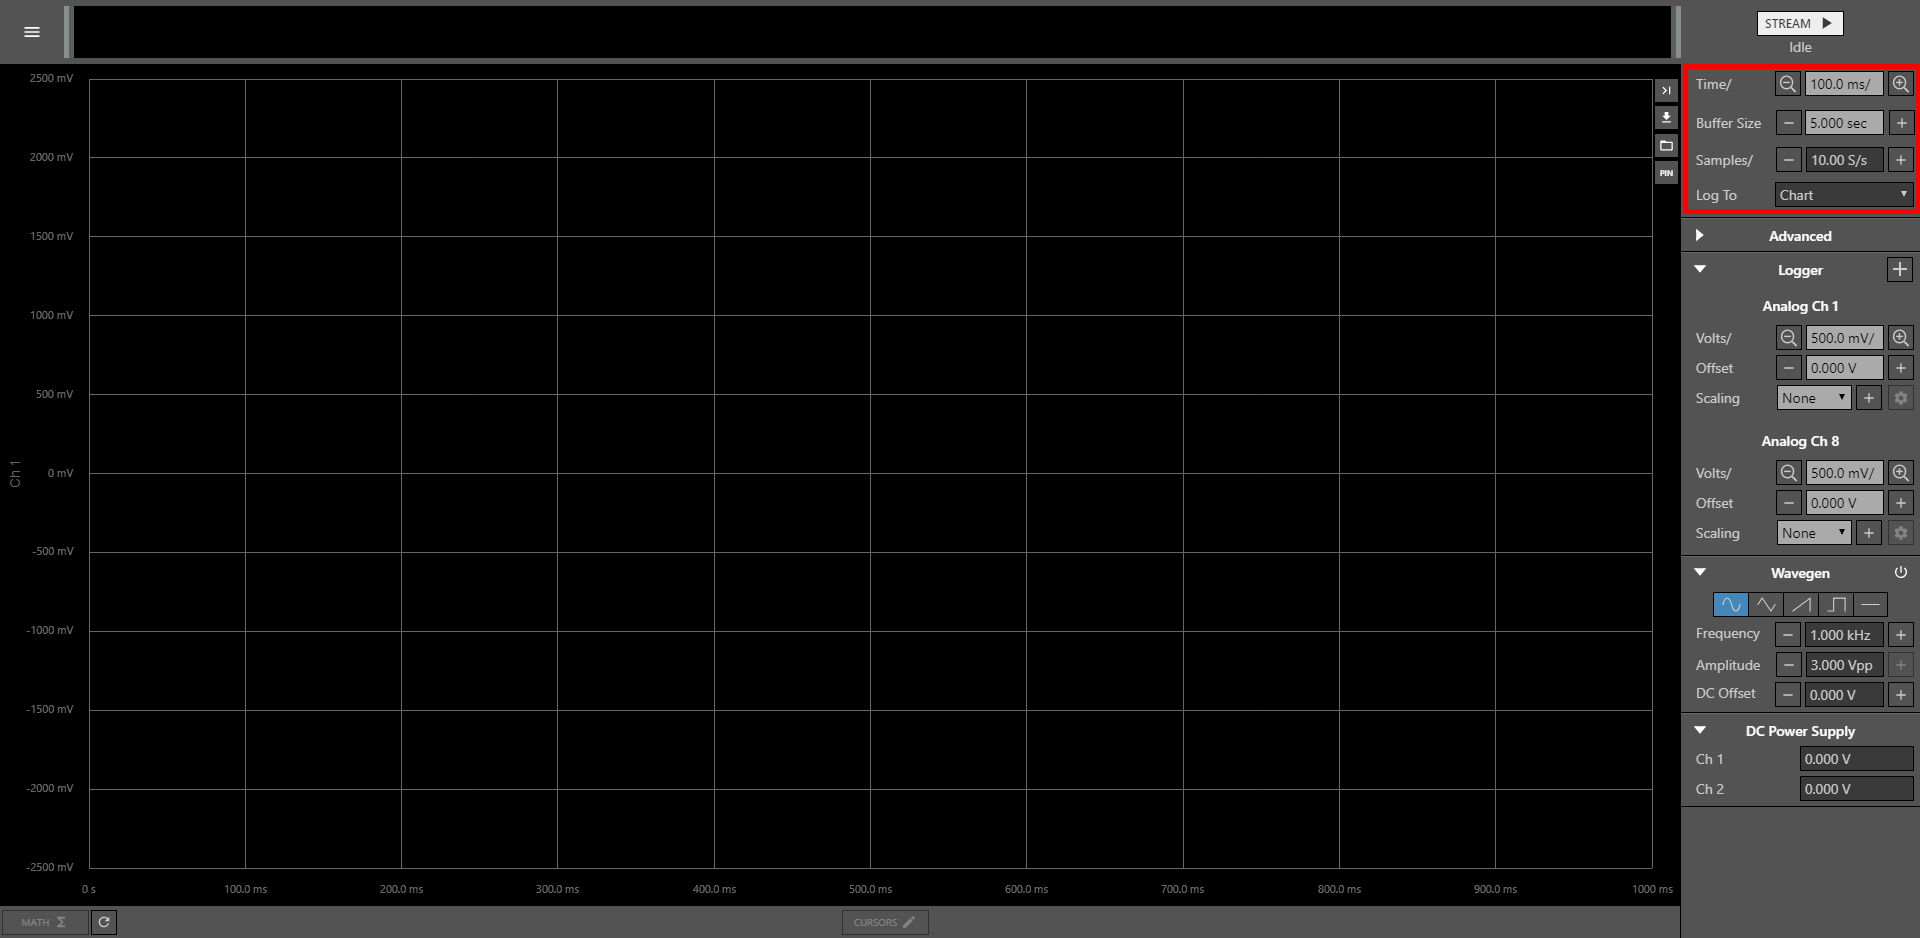
At the top of the Instrument Panel, the “Time/”, “Buffer Size”, and “Samples/” options also configure both how data is displayed on the chart and how data is logged. See the table below for more information on each of these options.
5.
The “Log To” drop down box allows the user to select whether logged data should be shown in WaveForms Live, or if it should be written to a file on an SD card plugged into the OpenLogger, or streamed to the cloud. This guide only discusses how to “Log To Chart”.
6.
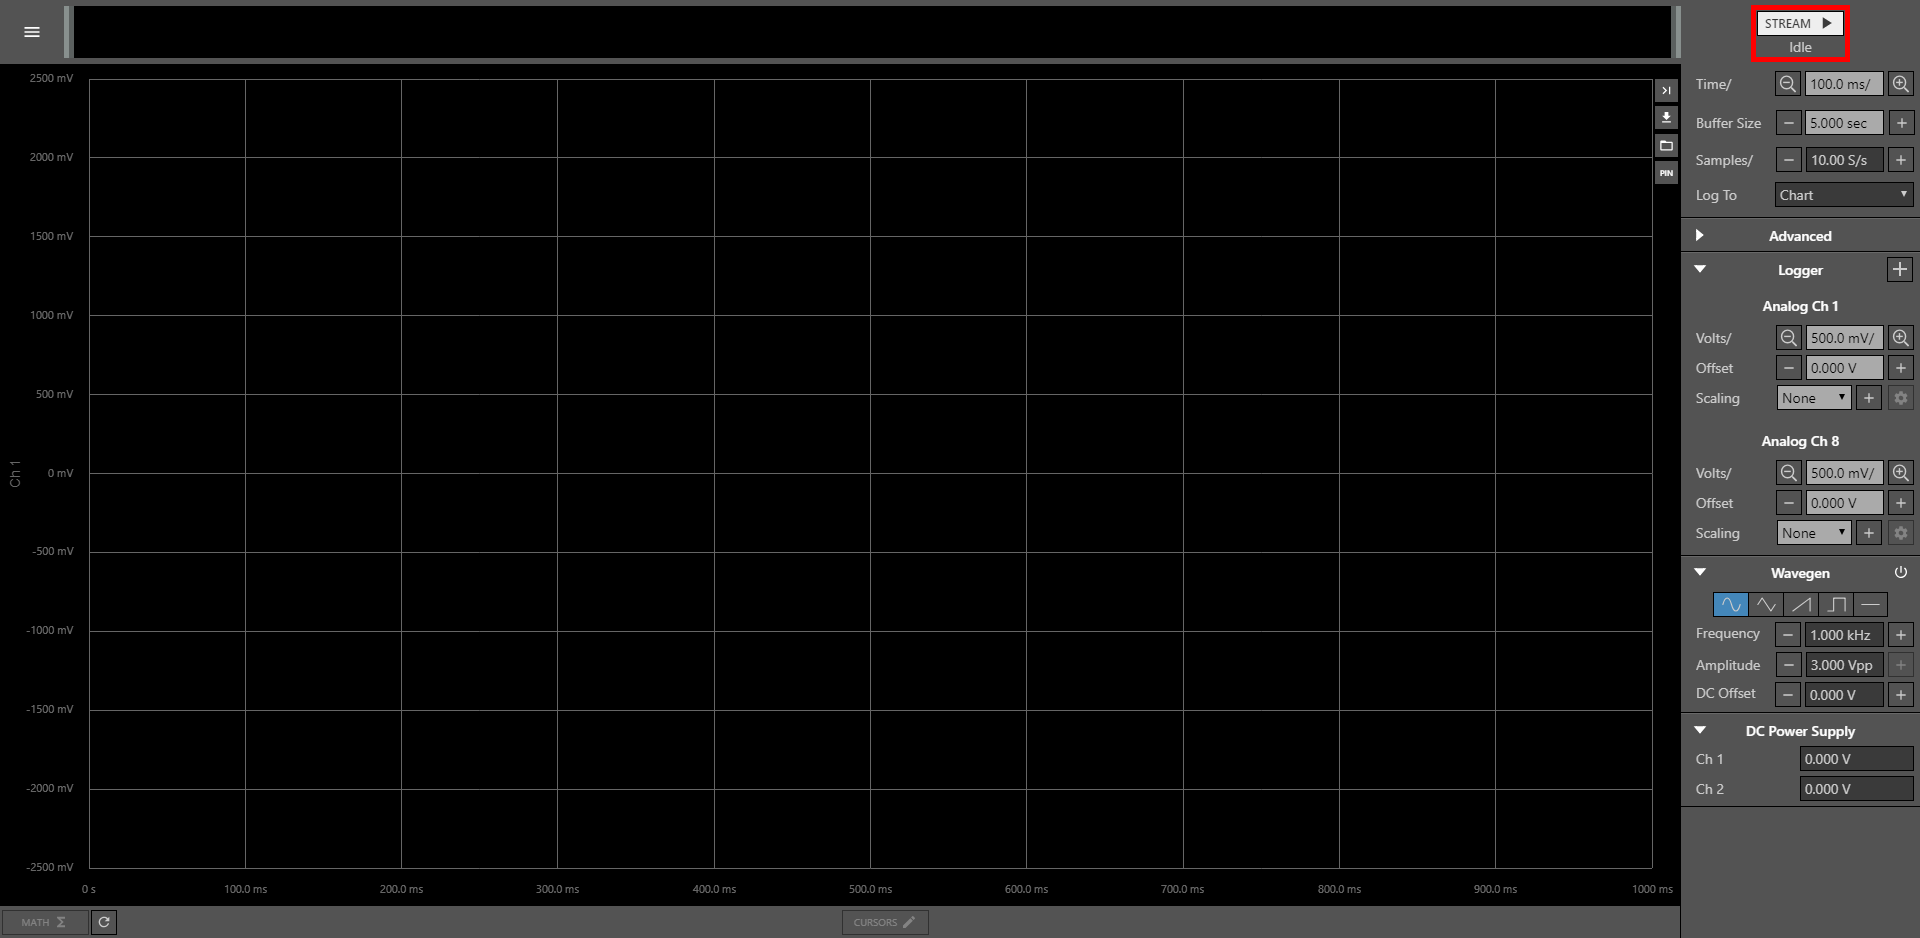
Clicking the STREAM button at the top right corner of the screen will make the OpenLogger begin logging data, which will then be displayed on the chart. Below the STREAM button is a status indicator, showing whether the OpenLogger is currently logging data or not.
7.
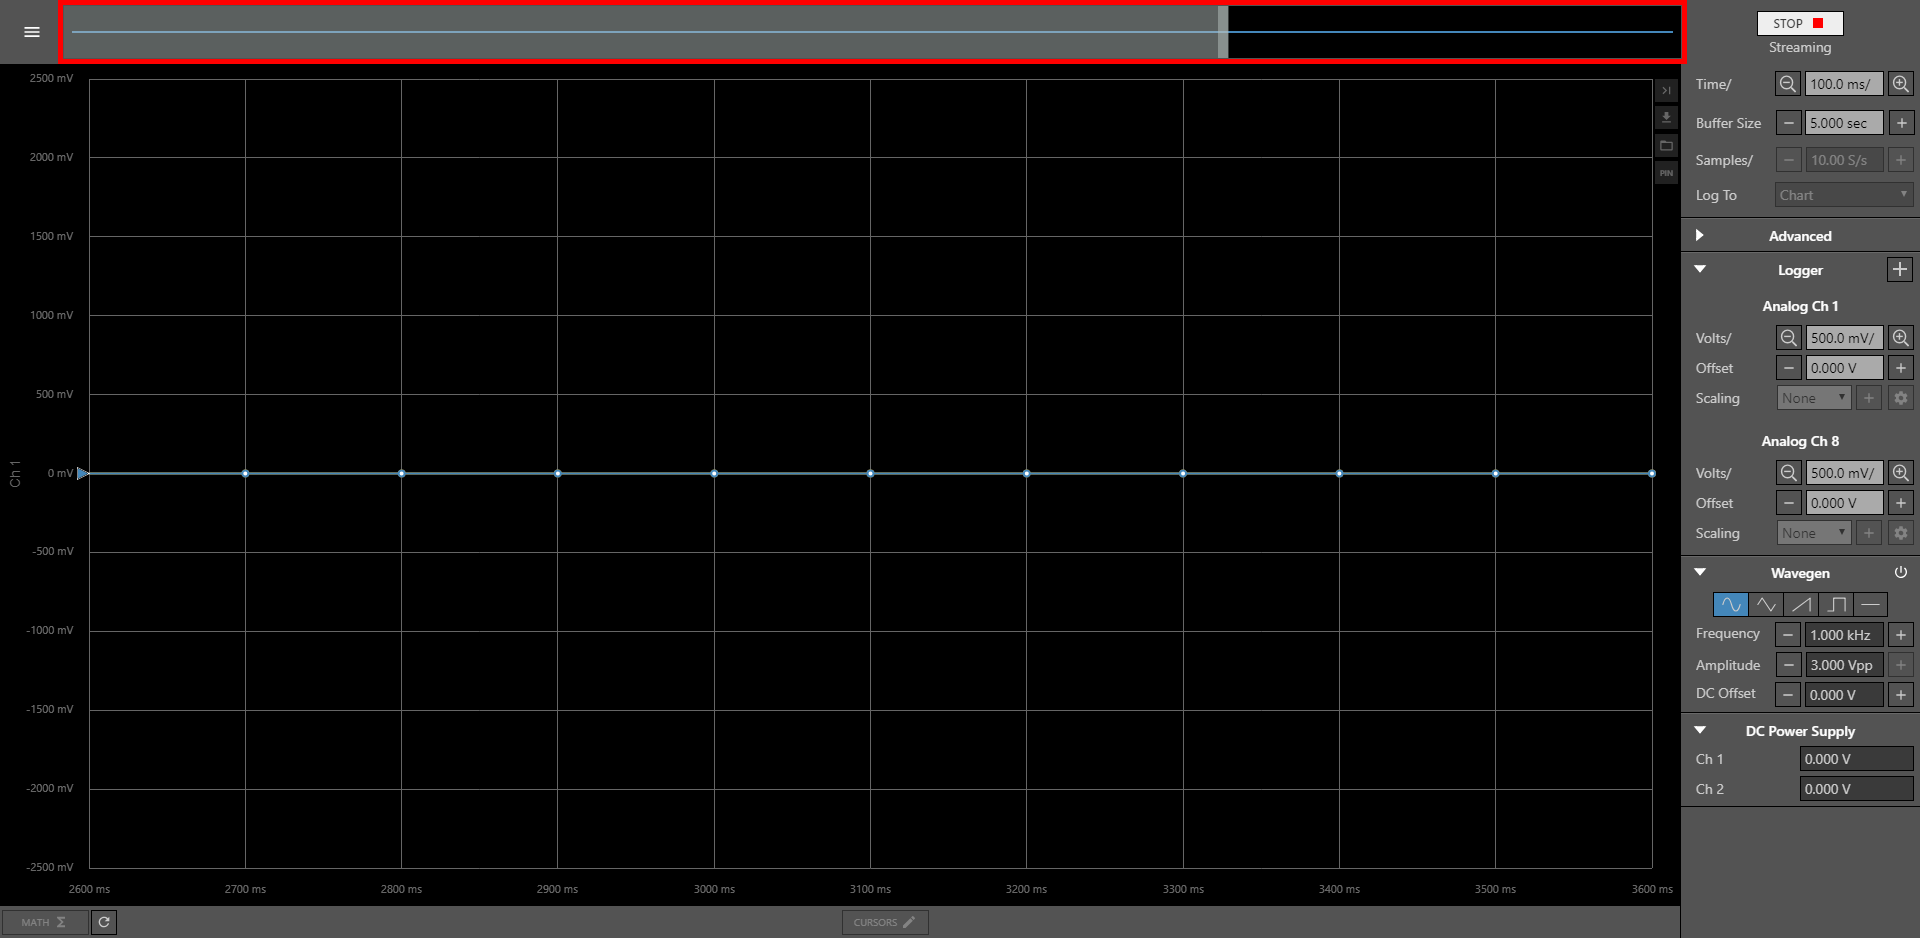
The bar at the top of the screen shows a preview of the contents of the data buffer. Note that the section of the buffer displayed in the main chart view can be changed by clicking and dragging the black section of this preview bar. The “width” of the area displayed in the chart can be changed by changing the “Time/” - time per horizontal chart division - configuration option.
8.
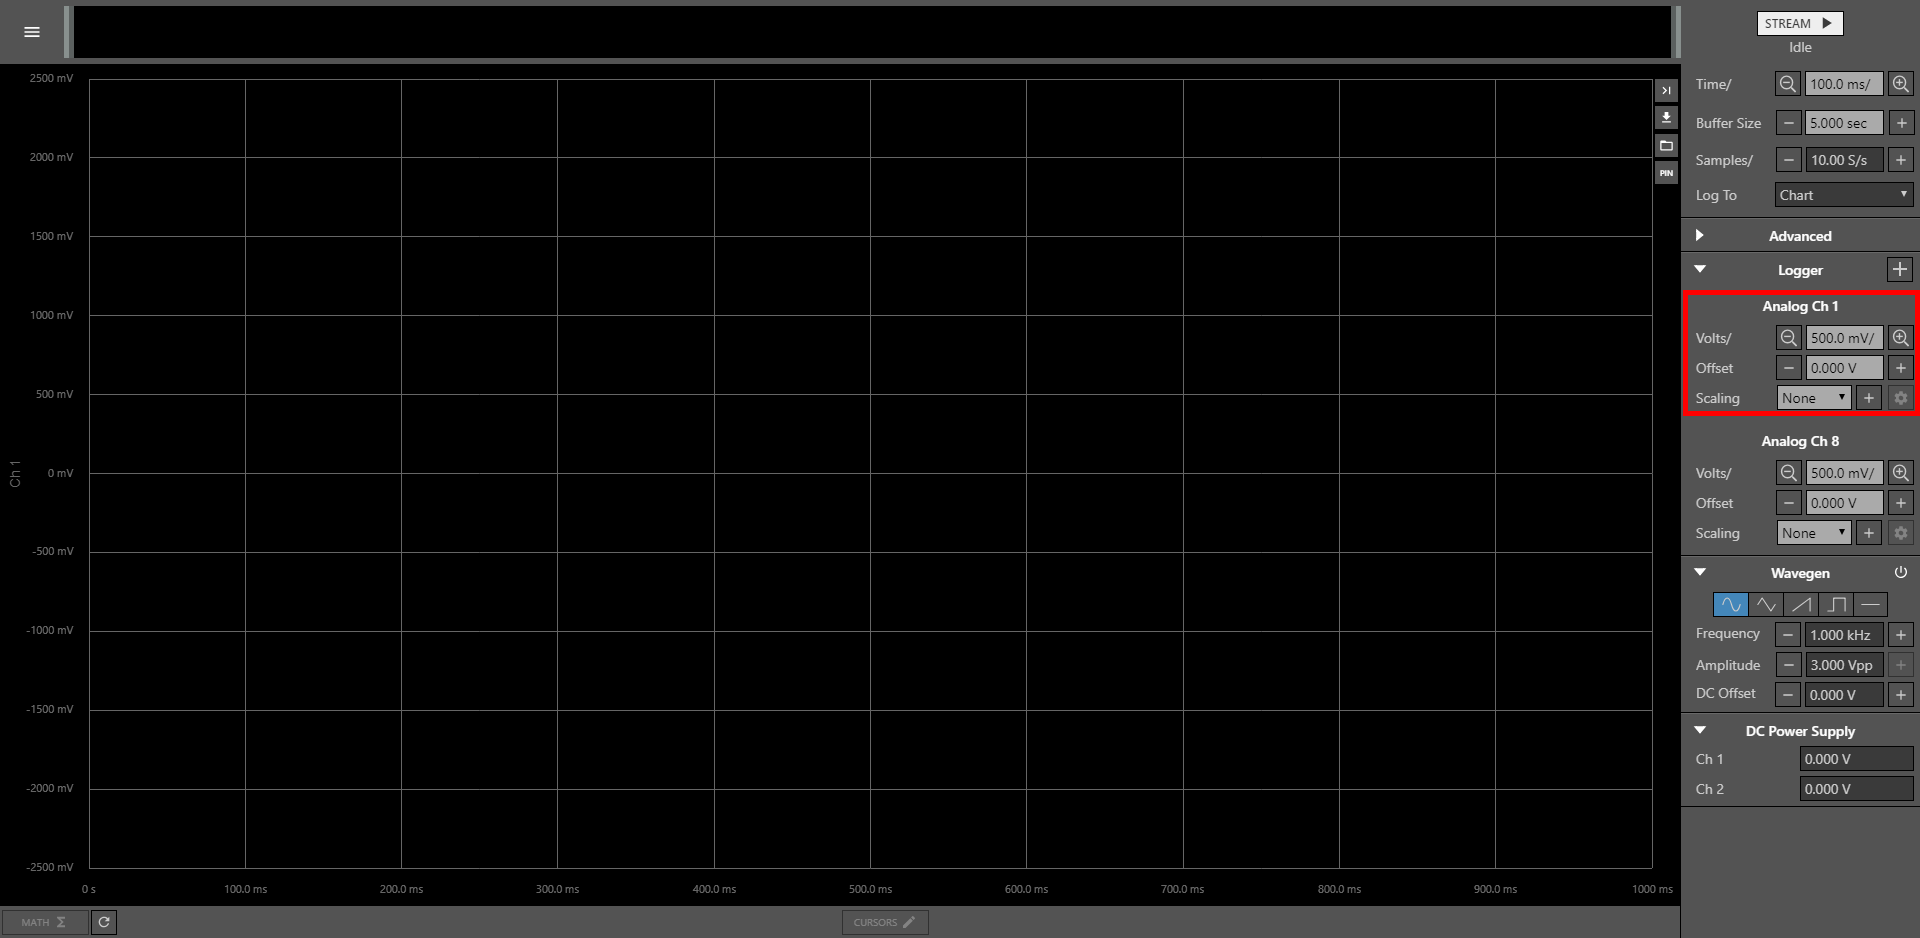
Each enabled channel has its own options in the Logger instrument. Each of these options configure how logged data is displayed on the chart, but do not affect how data will be logged. Each of these options will be further expanded on in steps 9 and 10 of this guide, below.
9.
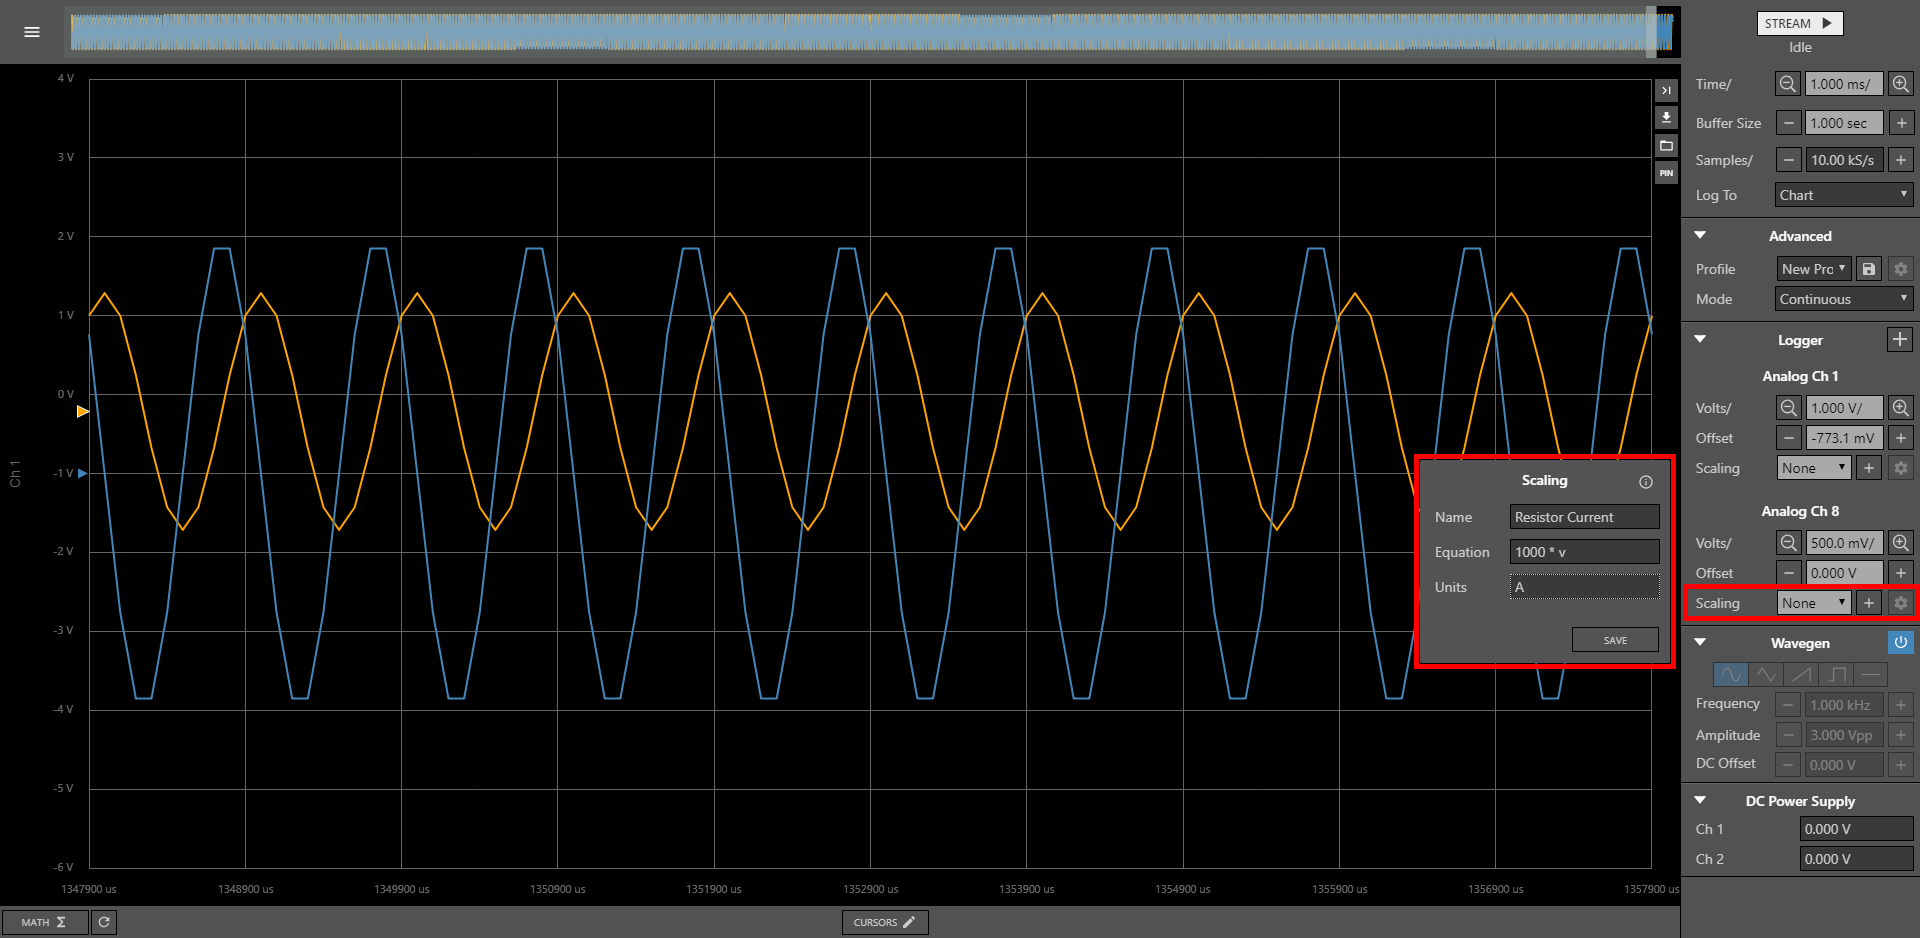
The “Scaling” option can be used to perform simple math operations and unit conversions on analog input channels. Clicking the “plus” button will create a new scaling configuration that can be applied to a channel. As an example, the image to the right shows a scaling configuration that can be used to chart an analog input channel measuring the voltage across a 1 KOhm resistor in its equivalent current, as determined by Ohm's Law.
10.
The vertical scale, as seen on the left side of the screen, can be changed by editing the “Volts/” - volts per vertical chart division - configuration option for that analog input channel. Alternatively, this scale can be quickly changed by holding the shift key and scrolling the mouse wheel.
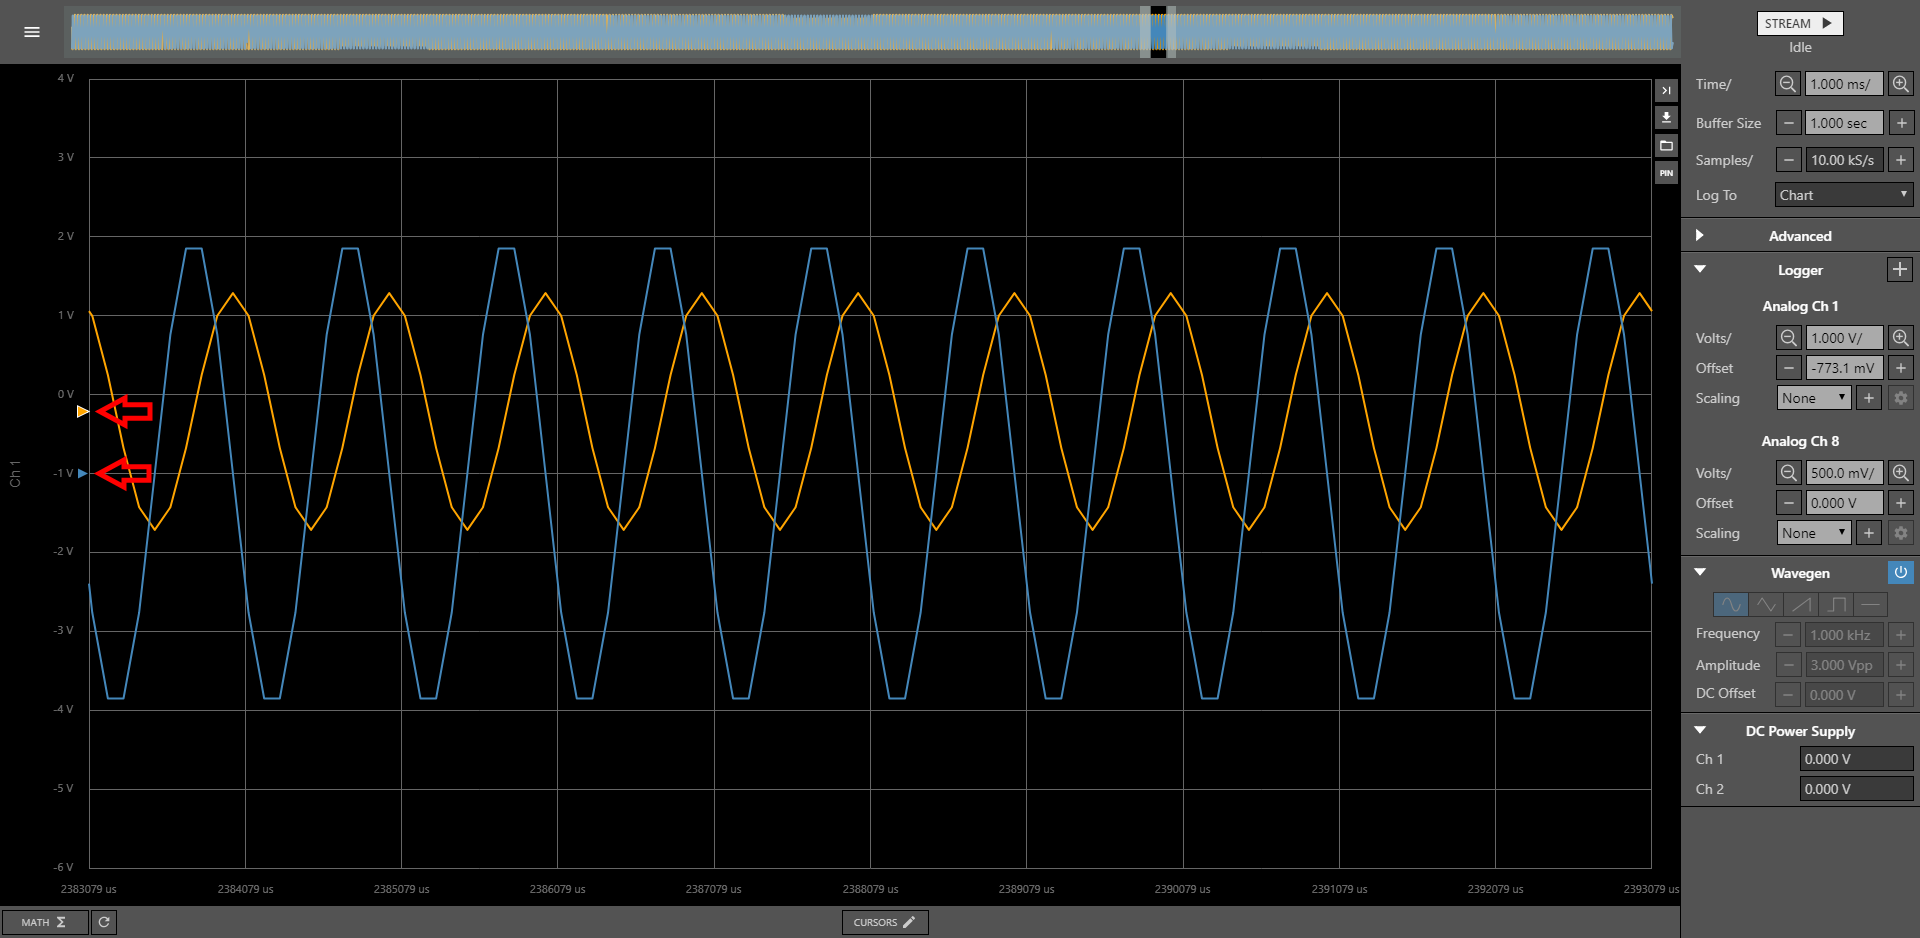
The vertical offset can be changed by editing the “Offset” configuration option for that analog input channel. The offset can be quickly changed by clicking on the triangular “handle” (as indicated in the image to the right) for that analog channel on the vertical axis at the left of the screen.
11.
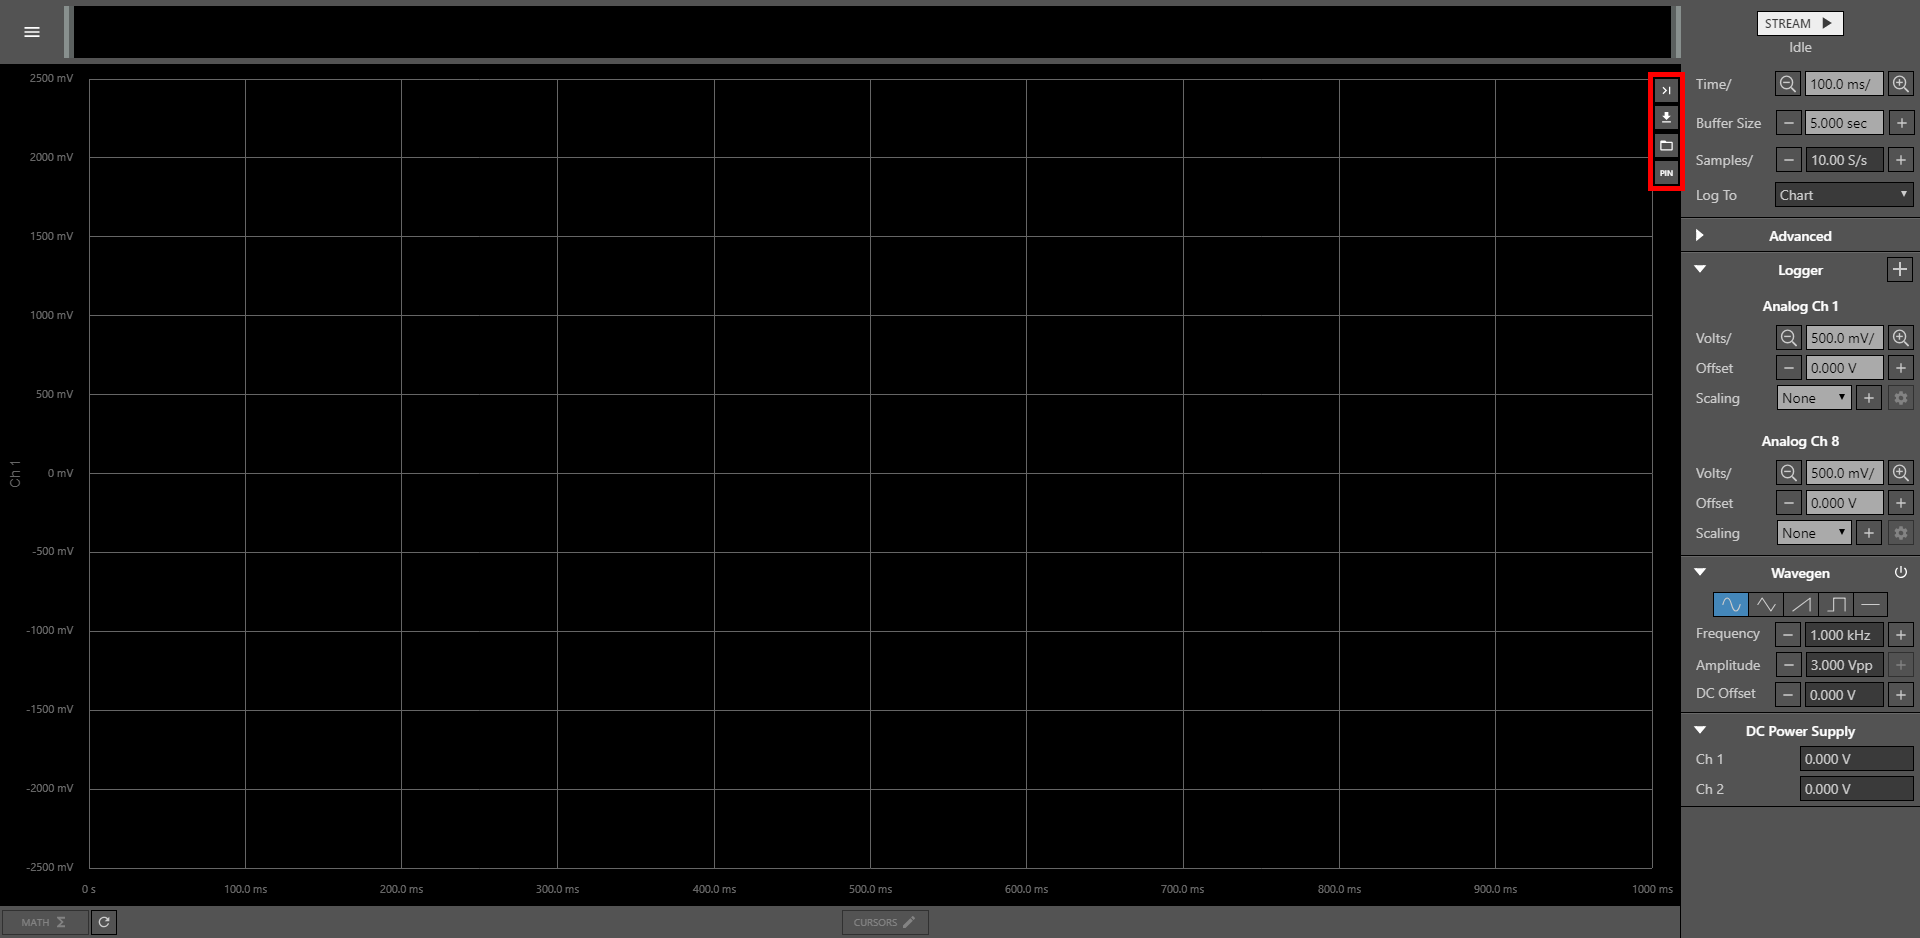
Lastly, the four buttons at the top right corner of the chart view:
- The uppermost button moves the viewing window in the data buffer to the end, to view the most recent samples.
- The second button can be used to export a CSV file or PNG image file. An exported CSV contains all logged samples in the buffer and can be used in Microsoft Excel, or other spreadsheet applications. Exporting a PNG file takes a snapshot of what is currently displayed on the chart.
- The third button launches a File Explorer, which can be used to browse the OpenLogger's filesystem. This can, for example, be used to grab data files logged locally on the OpenLogger.
- The fourth button displays the Pinout Diagram for the OpenLogger.

