Getting Started With Electronics Explorer (Mac)
Congratulations on your purchase of the Electronics Explorer! This guide will take you from opening the box, through installation, and all the way to taking your first measurement. This guide covers getting started in Mac OS 1). If this is the wrong operating system, go back to the main getting started guide and select the correct guide.
- Prerequisites
-
Nothing but an internet connection! Once you have an Electronics Explorer (EE Board), this guide will take you through what's in the box, installation of WaveForms, and taking your first measurement. Then you can get started with any of your embedded projects. However, WaveForms can also be operated in demo mode. If you don't yet have a EE Board, feel free to follow along with this guide and test out WaveForms in “EExplorer Demo” mode.
- Whats in the Box?
-

- EE Board
- USB A to micro B cable
- Starter Parts Kit
- 12 V external power supply
- US and EU plug adapters

- Download WaveForms
-
WaveForms is the software that configures, calibrates, and controls the EE Board. Through WaveForms, you have access to the EE Board's Oscilloscope, Arbitrary Waveform Generator, Logic Analyzer, Pattern Generator, Static I/O, Data Logger, Network Analyzer, Spectrum Analyzer, Protocol Analyzer, programmable Power Supply, Voltmeter, and Script Editor. This tutorial uses version 3.5.4 of the WaveForms software. Older editions of WaveForms (both 2.x.x and older versions of WaveForms) may also be used, although they may not have all of the same tools available.
Step 1:
Go to the WaveForms page and download the latest version of WaveForms. For a Mac, you'll need the .dmg file. Make sure the version you download is 3.5.4 or later.
- Installing WaveForms
-
Step 1: Launch the Installer

Double-click on the .dmg file you downloaded to open the installer.
Step 2: Install WaveForms

Drag the WaveForms icon over the Applications icon to install WaveForms. If you need help with the install process, you can click on the Help icon to open a Readme.
Step 3: Open the Digilent FTDI Driver to Open the Installer

Double-click the DigilentFtdiDriver.pkg icon to open the installer. The FTDI driver will allow WaveForms to communicate with Digilent devices.
Step 4: Security Warning

Depending on your security settings, you may get a security warning. This is normal.
Step 5: Allow the Installer to run

Open System Preferences and click on “Security and Privacy”. There should be a note to allow the Digilent FTDI driver to run. Click “Open Anyway”.
Step 6: Open the FTDI Driver

Double-click on the FTDI driver icon again to run it. Click “continue”.
Step 7: Click Continue

The next window is the readme. It is refreshingly short, so it shouldn't take long to read it. Click “Continue”.
Step 8: Read and Accept the License Agreement

Thoroughly read the license agreement. Click “Continue”. A pop-up will open asking you if you really accept the License Agreement. Click “Accept”.
Step 9: Start the Installation

Make sure you read the note on the window and click “install”.
Step 10: Wait for the Install to Finish

The install will begin. It's a relatively short install, and should only take a few minutes.
Step 11: Close the Installer

When the Installation is complete, click “close” to close the installer.
Step 12: Open WaveForms

Open your applications folder and double-click the WaveForms icon to open WaveForms. If you don't have the EE Board connected, you'll see this window. If you click “okay” the Device Manager will open. To connect your board, plug the EE Board into your computer by connecting the USB cable between the EE board and your computer, switching the Ready switch on the EE Board to “On”, and plugging in the 12 V auxiliary power supply.
Step 13: Select Your Device

Once the EE Board is connected or you select okay in the previous image, you'll see the Device Manager. Here you can select to either connect the EE Board, or if a EE Board is not connected run it in demo mode.
Note: If your EE Board does not appear in the device manager, you may have a problem with the FTDI driver. Restart your computer, and try installing the FTDI driver again. If that doesn't work, follow the steps in this thread.
Step 14: Explore the Main Window

Once you select the device or demo mode, you can explore the main WaveForms window. On the left-hand side, the navigation bar contains a button to open each of the tools.


- The Tools
-
Step 1: Explore the Navigation Bar
On the left-hand side of the screen you'll see the navigation bar. Each of the tools are represented by buttons. Click on
Scopeto open the Oscilloscope.
Step 2: The Oscilloscope

The oscilloscope has four separate channels that can sample at 40 MS/s and at 100 MHz bandwidth. The input voltage range is ±20 V. You can adjust the offset and range for the individual channels in their individual boxes on the right hand side as well as being able to adjust the the time base for the viewing screen. Users can also click on the “View” button in the upper left hand corner next to the “File” and “Control” buttons to get additional functionality out the oscilloscope including XY, FFT, and Spectrogram view. Go back to the main window by clicking the Welcome tab, and open the Waveform Generator by clicking
Wavegen.
Step 3: The Arbitrary Waveform Generator

The arbitrary waveform generator has two channels that have a bandwidth of 20 MHz each. You can select your signal type from a number of preset types (such as sine, trapezium, noise, and others) and its corresponding frequency, phase, amplitude, and aspects of the waveform. Users can also choose to perform a simple waveform generation, play a premade waveform, create a frequency sweep, and others. Go back to the main window and click
Supplies.
Step 4: The Power Supplies

The power supplies let you choose a variable positive and negative supply option ranging from 0 to +9 V and 0 to -9V, respectively, as well their supplied current of up to 1.5 A. The fixed digital power supply can be set to either 3.3 V or 5 V and can supply up to 2 A. Custom reference voltage voltages are available as well. Go back to the main window and click
Voltmeter.
Step 5: The Voltmeter
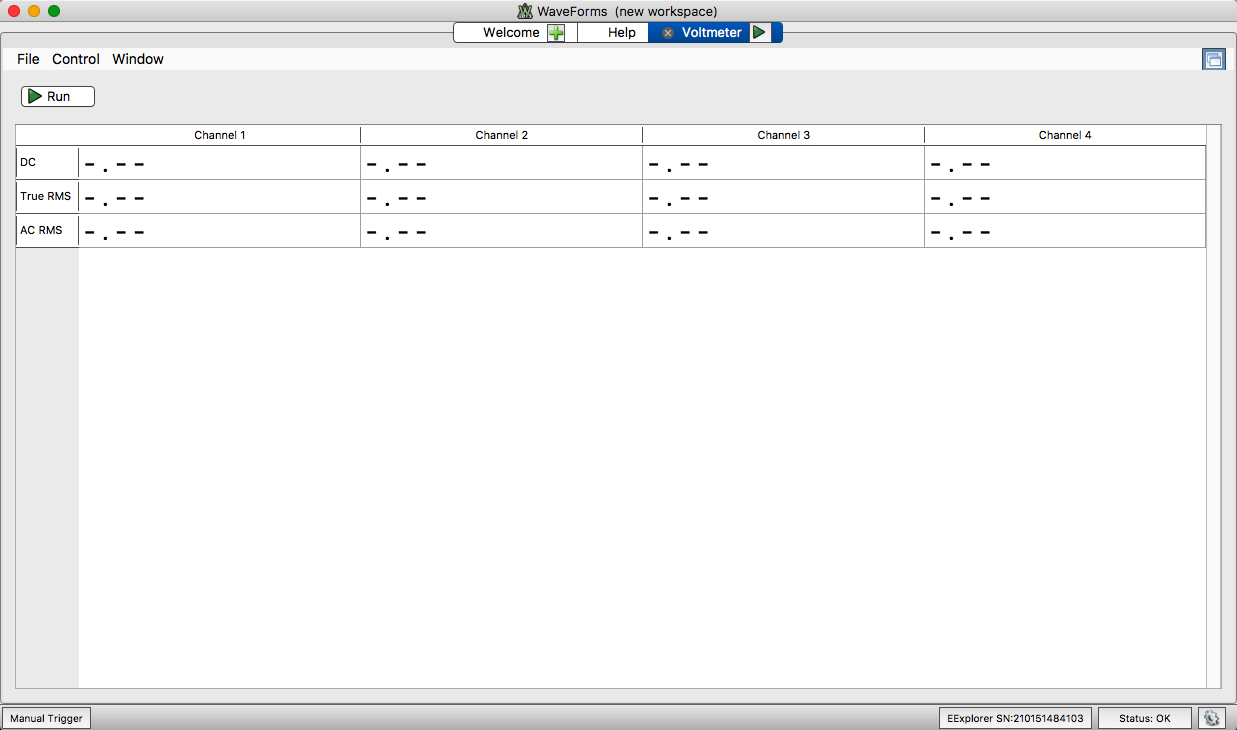
The voltmeter provides the measured voltages on the 4 channels including the measured DC, true RMS, and AC RMS voltage. All of the voltmeter ports are available on the Analog section of the EE board. Go back to the main screen and select
Logger.
Step 6: The Data Logger

The data logger takes over the oscilloscope channels (the oscilloscope will take control back if it is re-enabled) and windows the oscilloscope sweeps and plots the measured DC, true RMS, and AC RMS voltage. Go back to the main window and select
Logic.
Step 7: The Logic Analyzer

With the logic analyzer, you can add up to 32 Digital input channels. By clicking on “Click to Add Channel”, or the green plus button, you can add signal and bus analyzers. Built in are signal, bus, SPI, I²C, UART, CAN, I²S, and 1 wire. Provided in the same menu is a custom option that allows you to create your own analyzer. Go back to the main window and select
Patterns.
Step 8: The Pattern Generator

The pattern generator allows you to send out a wide variety of digital signals. By clicking “Click to add channels”, or the green plus button, you can add an individual signal, bus, or ROM logic. If you add an individual signal, you can add a constant signal, clock, pulse, random signal, or custom signal. If you add a bus signal, you can add a constant signal, number, clock, pulse, random signal, custom signal, binary counter, gray counter, Johnson counter, walking 1, or decimal counter. Go back to the main window and select
StaticIO.
Step 9: The Static I/O

Static IO allows you to test how your system communicates with several types of circuit IO. If you select Bit IO or change the channels individually, you will have access to virtual LEDs, buttons, and switches. Alternatively, selecting slider, progress bar, or seven segment will combine 8 channels of IO into each of those features. Go back to the main window and select
Network.
Step 10: The Network Analyzer

The network analyzer takes control of both the oscilloscope and waveform generator; typically a channel of each the waveform generator and oscilloscope are used to create (and measure) a signal going into a filter and then a second oscilloscope channel reading the output signal coming from the filter. Users can set a desired start and stop frequency in addition to the number of steps to take between the two frequencies at the top of the GUI. The “View” option next to the “File” and “Control” allows for some additional views including Nyquist and Nichols plots. Go back to the main window and select
Spectrum.
Step 11: The Spectrum Analyzer

The spectrum analyzer uses the oscilloscope channels to measure the magnitude of a signal in relation to its frequency. Users may select the frequency range (which determines the sample rate) that the oscilloscope channel samples the signal of interest as well as displaying the type of trace you wish to see. Users may also adjust the y-axis of the viewing screen to different ranges, increments, or different units. Go back to the main window and select
Protocol.
Step 12: The Protocol Analyzer

The protocol analyzer turns the EE Board into a UART, SPI, or I²C device, allowing you to send and receive data through the interface. Users can change a number of settings including the frequency, polarity, and data to send. Custom scripts for SPI and I²C can be used as well. Go back to the main window and select
Script.
Step 13: The Script Editor

In the case that any of the previous tools don't allow you to complete the test and analysis that you need, the script editor provides a JavaScript editor that you can use to run custom tests. Different examples are available in the “Examples” drop-down menu as well as the option of adding a plot in the “View” menu. Further examples and functions can be found in “Help” drop-down at the top of the WaveForms GUI under “Browse”. Choose the “Script” option on the left hand side of the webpage that is pulled up to learn more.


- Taking Your First Measurement
-
Step 1: Plug in your EE Board

If you have not done so, plug in your EE Board into your computer by connecting the USB cable between the EE board and your computer, switching the Ready switch on the EE Board to “On”, and plugging in the 12 V auxiliary power supply.
Step 2: Select Your Device
If you have not done so, select the EE Board in the Device Manager. The Device Manager can be accessed anytime from the main toolbar. Open the settings menu and select Device Manager.
Step 3: Start the Waveform Generator

Open the Waveform Generator by clicking
Wavegen.Choose what type of signal you want to generate by choosing it in the drop-down menu next to “Type”. Additional parameters such as the frequency and the amplitude can be adjusted as well.
The channel you are using can be selected in the “Channels” drop-down menu next to the green “Run All” button. Note that only channels 1 and 2 can be used on the EE board as that is the number of Arbitrary Waveform Generators (AWGs) that are available. Channel is used by default and is available on the Analog section of the EE Board.
Click Run. If you choose the same settings that I did, you will see a very similar screen as to what is shown above.
Step 4: Start the Pattern Generator

Open the Pattern Generator by clicking Patterns.
Click on the green plus sign and select signal. Other types of digital outputs are available as well.
Select DIO 31, and click the green plus sign. Click “Add” to choose this pin (available on the Digital 4 segment on the EE board) as your digital output.
In the type column, use the drop-down to select Clock. Other types can be chosen as well. You can adjust the clock rate by clicking on the pencil edit button located between the listed digital pin that is being used and the output type.
Click Run. If you choose the same settings, your screen should look like the image above.
Step 5: Prepping for Measurement

The EE Board comes with the starter parts kit which contains a number of pre-trimmed jumper wires which can be used to make a number of crisp circuits. This tutorial uses the oscilloscope to measure the signal from the arbitrary waveform generator, so a pair of wires (or a single wire) should be used to connect the AWG 1 to the DC input of Scope 1 on the EE board. Similarly, the logic analyzer is measuring the data from the pattern generator, so a wire (or a pair wires) should be connecting digital pin 31 to pin 27 on the Digital 4 section of the EE Board.
Step 6: View your First Measurement

Go to the main window and click Logic to open the Logic Analyzer and Scope to open the Oscilloscope tabs. Multiple tools can be viewed simultaneously within WaveForms by clicking on the small windows button in the upper right hand corner of the WaveForms GUI.
The time bases on the Logic Analyzer and Oscilloscope can be set to nicely capture your signals; this tutorial is running the waveform generator at 200 kHz, so the oscilloscope is set to a time base of 10 μs/div. Channel 1 on the oscilloscope is used to capture data from the AWG (available on the Scope section of the EE Board. Click run to start collecting data on the oscilloscope.
The pattern generator has a default rate of 1 kHz for the clock, so the logic analyzer can use a time base of 1 ms/div for a viable view. Click on the the green plus sign to bring up a menu to select what type of signal to analyze. This tutorial is generating a clock so choose “signal” and select the digital pin you wish to use as the input; digital input pin 27 was chosen (available on the Digital 4 section of the EE Board) by clicking the add button. Click the Run button (next to the Single button) to start collecting data from the pattern generator.
Congratulations! You now have four different tools operating simultaneously! Keep playing around with the tools and visit forum.digilent.com for questions or technical issues.


