This is an old revision of the document!
Using the Network Analyzer

Introduction
This guide explains the use of the Network instrument in WaveForms. This instrument is used to measure the frequency response of a circuit-under-test.
Prerequisites
- A Digilent Test & Measurement Device with Analog Input and Output Channels
- A Computer with WaveForms Software Installed
Guide
1. Opening the Network Analyzer
1.1
Plug in the Test & Measurement Device, then start WaveForms and make sure the device is connected.
If no device is connected to the host computer when WaveForms launches, the Device Manager will be launched. Make sure that the device is plugged in and turned on, at which point it will appear in the Device Manager's device list (1). Click on the device in the list to select it, then click the Select button (2) to close the Device Manager.
Note: “DEMO” devices are also listed, which allow the user to use WaveForms and create projects without a physical device.
Note: The Device Manager can be opened by clicking on the “Connected Device” button in the bottom right corner of the screen (3), or by selecting “Device Manager” from the “Settings” menu at the top of the screen.

1.2
Once the Welcome page loads, in the instrument panel at the left side of the window, click on the Network button to open the Network Analyzer instrument.

1.3
Once the Network Analyzer instrument opens, the window contains the plot plane split horizontally into two subplot planes, the control bar above the plot planes, and the configuration panel to the right of the plot plane.

2. Using the Network Analyzer
This section walks through setting up the Network Analyzer to plot data from the Wavgen channels.
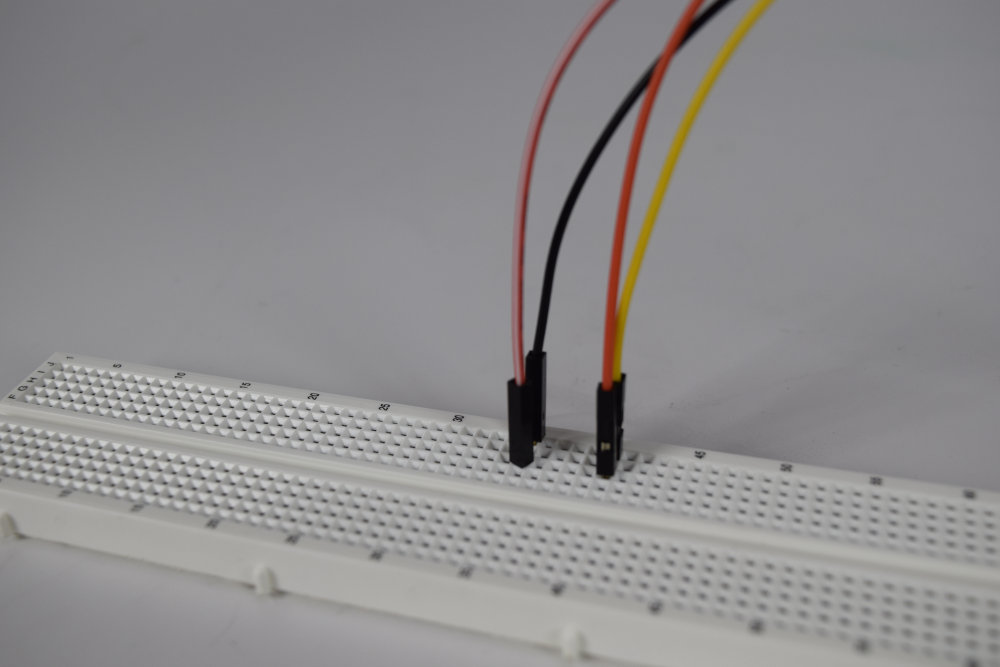
2.1 Hardware Setup
Connect the Test & Measurement Device's scope Channel 1 pin (orange wire) to the device's wavegen Channel 1 output pin (yellow wire). For devices that use differential input channels, such as the Analog Discovery Studio with MTE cables, make sure to connect the scope Channel 1 negative pin (orange wire with white stripes) to the ground pin associated with wavegen Channel 1 (black wire).
2.2 Run the Network Analyzer
By default, the Network Analyzer uses the Test & Measurement Device's wavegen channel 1 as the source signal and does not need any further configuration from the wavegen instrument window. From the control bar, click Run to continuously sweep the circuit network with an input signal of varying frequency - by default, the frequency sweep ranges from 1kHz to 1MHz.
While sweeping, the Run button ( ) changes to Stop (
 ). Click Stop to stop outputting analog voltages, and to stop capturing data on the analog input pins. Click Single (
 ) to sweep the circuit network only once. With the wavegen connected to the scope Channel 1 input, the plot planes should show Channel 1 (yellow traces) as a flat 0db magnitude plot, Channel 2 (blue traces) magnitude plot increasing from -50dB to 40dB, and Channel 2 phase plot decreasing from 90 degrees to 0 degrees.

2.3 Plot Plane Axes
By default, the top pane displays the magnitude response of the circuit network in decibels (from +10dB to -90dB) and the bottom pane displays the phase response of the circuit network in degrees (from +180° to -180°). These respective values are on the left side vertical axis and are adjusted using the configuration panel.
The bottom axis is shared by both plots and by default displays every frequency in the sweep range (1kHz to 1MHz). The range can be adjusted using the Control Bar. Alternately, the range can be changed by hovering a mouse over an axis or plot plane and scrolling the mouse wheel.

2.4 Data Cursors
To take a quick measurement of the plotted magnitude and phase at a given frequency, click the Quick Measure: Vertical button ( ), located at the top right corner of the top plot plane. Move the cursor over the plot pane and observe the values displayed. Click once to set that cursor, click a second time to generate a second delta cursor, then click a third time to place the delta cursor. A fourth click or clicking the Quick Measure: Vertical button again will remove these cursors.
To place one or more normal or delta cursors, click the Add Cursor button in the bottom left plane. The first click will generate a normal cursor and repeated clicks will generate additional delta cursors referenced to the first cursor. To change the delta cursors to a normal cursor, click the arrow icon on that cursor's button on the bottom of the plane plot and change reference to “none”. Additionally, selecting “Remove” will delete the cursor from the plot plane.

3. Network Analyzer User Interface Overview
This section walks through the wide variety of controls and features present in the Network instrument.
3.1 Control Bar
The Control Bar can be found above the plot pane. The control bar contains the Single and Run acquisition buttons, as well as several settings that control the frequency sweep used to probe the circuit under test, accessible via either drop-down menus or text field, .
- Scale: Logarithmic or Linear, defines the frequency scale used on the plot, as well as the method used to determine frequencies to be measured.
- Start & Stop: Define the frequency range of the sweep.
- Samples: Controls how many samples are captured during an entire sweep. Changing this setting will also change the “/Decade” (or “Step”) setting, and vice versa.
- /Decade: “Samples per Decade”, controls how many samples are captured during a sweep. A “decade” represents a factor of ten between two frequencies. For example, if a sweep starts at 10kHz, and /Decade is set to 20, 20 samples will be captured between 10 and 100kHz, 20 samples will be captured between 100kHz and 1MHz, etc. (Only applicable for Logarithmic scale)
- Step: Controls how many samples are captured during a sweep. Defines the change in frequency between each sample. (Only applicable for Linear scale)
These settings can also be changed by clicking and dragging the plot or by using the mouse wheel - “panning” and “zooming” the plot.

3.2 Configuration Panel
To the right of the plot planes is the configuration panel. The top window selects the sweeping signal source and is WaveGen Channel 1 by default. To change to WaveGen Channel 2 or an external source, click the Gear icon ( ) and select the desired channel. To apply a DC offset or change the sweep wave amplitude, click the Offset and Amplitude drop-down menus, respectively.
Below the signal source window is the Magnitude plot configuration window. By default, the units are decibels with a ceiling of 10dB and a floor of -90dB. These parameters can be changed by selecting the drop-down menus labeled Units, Top, and Bottom, respectively.
Below the Magnitude plot configuration window is the Phase plot configuration window. By default, the Offset and Range are set to 0 degrees and 360 degrees, respectively. To change these values, click the Offset and Range drop-down menus, respectively.
Below the Phase plot configuration window are two Custom measurement windows. By default, these windows are deselected. To add a custom measurement, click the selection box on the left side of the custom window name and that window will be added to the plot plane. To change the scale, units, and name for the window, click Gear icon () and update the Scale, Units, and Name fields. To change the range of the plot, click on or type into the Top and Bottom fields. Click the bottom button to change or program a custom measurement. By default, Custom channel 1 is set to measure a Real value and Custom channel 2 is set to measure an Imaginary value.
Below the Custom window buttons is a Add Channel button ( ). Click this button to add a new channel in reference to the current Channel 1 or Channel 2 measurements.
Below the Custom/Add channel buttons are the Channel 1 and channel 2 configuration windows. By default, the Offset and Gain parameters are set to 0 volts and 1x, respectively. To change these values click on or type in the Offset or Gain fields, respectively.

3.3 Plot Pane
The plot pane displays data captured on the analog input channels during the stimulus sweep. The horizontal axis of the plot represents the sample frequency. The vertical axis in the top plot represents the gain of the circuit. The vertical axis in the bottom plot represents the phase shift imposed on the test signal by the circuit under test.
A status indicator in the top left corner of the plot pane displays whether the Network Analyzer is running (“Stop”/“Running”). While a sweep is underway, the progress is shown. While stopped, information about the sweep being displayed is shown, including sample count, frequency range, and a timestamp.
3.3.1 Plot - Utilities
The Utility button () in the top right corner of the plot pane can be used to add labels to the plot, change the background color and line width, as well as set the default quick-measure tool.

3.3.2 Plot - Quick Measure Tools
Another set of buttons can be found in the upper right corner of the plot pane:
- Free (
 ) measures the difference between two mouse clicks, expressed in magnitude (or phase) and frequency.
 - Vertical (
 ) is similar to Free mode but measures differences between two vertical lines, rather than two points. It can be used to display both phase and magnitude differences at once.
 - Show Entire Capture (
 ) resets any pans or zooms made on the plot, displaying the entire sweep.

3.4 File Menu
The File menu at the top of the window contains operations that affect the filesystem of the host computer.
Saving a project (with or without any acquisitions) allows the user to close WaveForms without losing any configurations. In addition to this, projects can be shared with others to aid in group projects and guided learning.
Exporting data as an image allows the user to produce a screenshot of the entire Scope tool. Alternatively, captured data can be exported in a variety of different file formats, including CSV, TXT, and TDMS.

3.9 Control Menu
The Control menu at the top of the window provides the same functionality as the Single/Stop/Run buttons, and lists hotkeys that can be used for each.

3.5 View Menu
A wide variety of different view panes can be added to the user interface using the View menu in the toolbar above the Single/Run/Stop buttons. Each pane, once opened, can be closed by clicking the “X” button in the top right corner of its pane. A description of each view in the menu is listed below:
- Time: Displays the signal captured on the analog input channels, in the time domain.
- FFT: Displays a Fast-Fourier Transform breakdown of the sweep.
- Nyquist: Displays a Nyquist plot of the sweep.
- Nichols: Displays a Nichols plot of the sweep.
- Cursors: Lists each “X” cursor added to the plot.
- Notes: A text editor pane that can be used to document configuration choices, or whatever other information could be useful to remember.

Next Steps
For more guides on how to use the Digilent Test & Measurement Device, return to the device's Resource Center, linked from Instrumentation page of this wiki.
For more information on WaveForms visit the WaveForms Reference Manual.
For technical support, please visit the Scopes and Instruments section of the Digilent Forums.